
React and TypeScript web applications

Dashboards and Reports

A dashboard answers a management question only when its metric formula and data freshness are known.

Discuss this directionContact form

Tell me the goal, stack constraints, and timeline — I reply on Telegram.

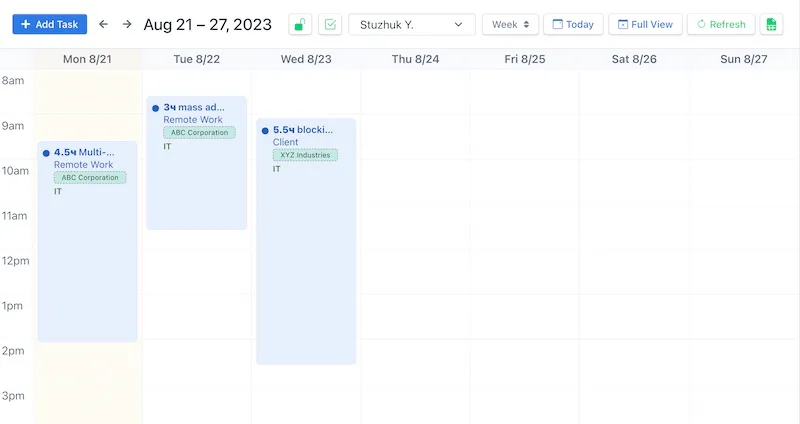
A dashboard answers a management question only when its metric formula and data freshness are known. I build reporting interfaces with filters, drill-down, and exports, starting with metric definitions rather than chart selection.

Scope includes queries and aggregates, APIs, tables, charts, roles, last-updated markers, and empty or incomplete states. Power BI, Metabase, or another BI tool is often better for open-ended analytics. Acceptance compares a control dataset with the reference calculation, checks filter denominators and source-row drill-down, marks stale data, and ensures exports reproduce the visible slice.
FAQ

Tap a question to expand the answer.

Can we keep using Excel?

Yes, for an occasional report whose owner controls the formulas. A dashboard becomes valuable with frequent updates, several roles, and one shared metric definition.

Who defines the formulas?

The business owner confirms their meaning; I encode it in queries, tests, and interface guidance rather than guessing the financial method.

Discuss this directionContact form

Tell me the goal, stack constraints, and timeline — I reply on Telegram.

View full service page